Make better posters with RMarkdown + posterdown.


1 Department of Earth Sceicnes, Brock University
This is the posterdown_betterland template for the {posterdown} package! I was inspired by the twitter thread of Mike Morrison and wanted to apply the #betterposter concept to the reproducible (yet simple to use) functionality of the {posterdown} package (Thorne 2019). If you’re not an R user don’t sweat as you do NOT need to use it at all! Feel free to use only the Markdown functionality of this package :)
I will show here how to include poster elements that may be useful, such as an equation using mathjax:
\[ E = mc^2 \]
To reference a citation you can add your .bib file to the working directory and name it in the YAML metadata or generate an automated one as done here, then you only need to reference the label value in the .bib file. For example this package is built on top of the wonderful {pagedown} package and I will cite it at the end of this sentance using this in the rmd [@R-pagedown] (Xie et al. 2021).
To get a better understanding of how to include features like these please refer to the {posterdown} wiki.
Now on to the results!
Here you may have some figures to show off, bellow I have made a scatterplot with the infamous Iris dataset and I can even reference to the figure automatically like this, Figure \@ref(fig:irisfigure), Figure 1.
 from the legend himself, [Yihui Xie](https://twitter.com/xieyihui).](betterposter_files/figure-html/irisfigure-1.png)
Figure 1: Here is a caption for the figure. This can be added by using the “fig.cap” option in the r code chunk options, see this link from the legend himself, Yihui Xie.
Maybe you want to show off some of that fancy code you spent so much time on to make that figure, well you can do that too! Just use the echo=TRUE option in the r code chunk options, Figure 2!
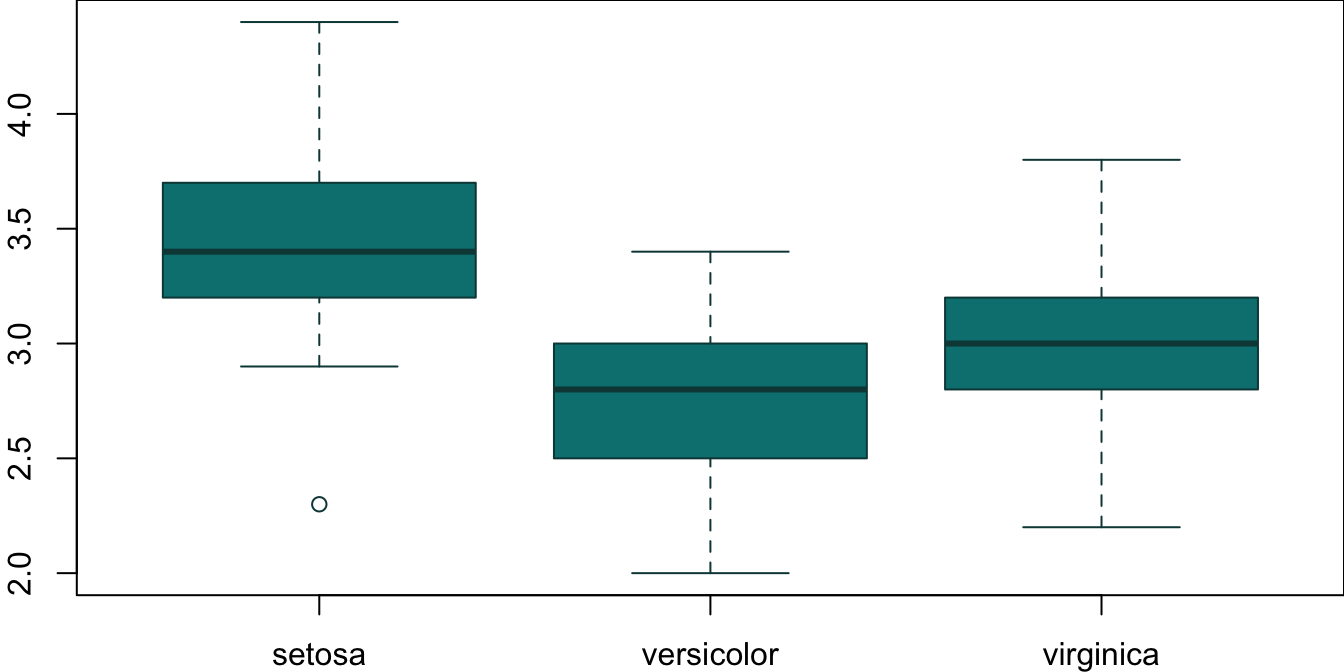
Figure 2: Boxplots, so hot right now!
How about a neat table of data? See, Table 1:
|
Sepal Length |
Sepal Width |
Petal Length |
Petal Width |
Species |
|---|---|---|---|---|
| 5.1 | 3.5 | 1.4 | 0.2 | setosa |
| 4.9 | 3.0 | 1.4 | 0.2 | setosa |
| 4.7 | 3.2 | 1.3 | 0.2 | setosa |
| 4.6 | 3.1 | 1.5 | 0.2 | setosa |
| 5.0 | 3.6 | 1.4 | 0.2 | setosa |
| 5.4 | 3.9 | 1.7 | 0.4 | setosa |
| 4.6 | 3.4 | 1.4 | 0.3 | setosa |
| 5.0 | 3.4 | 1.5 | 0.2 | setosa |
Make better posters with RMarkdown + posterdown.