Estimate power for proportion conflict effect using monte-carlo simulation, return table and plot
pc_power_table.RdEstimate power for proportion conflict effect using monte-carlo simulation, return table and plot
pc_power_table(
  subjects,
  differences,
  base_conflict,
  mc_c_nmst,
  mc_nc_nmst,
  mnc_c_nmst,
  mnc_nc_nmst,
  num_sims = 100,
  alpha = 0.05
)
Arguments
| subjects | A vector for the numbers of subjects across simulated experiments |
|---|---|
| differences | A vector for the sizes of differences between conflict effects |
| base_conflict | A number setting the size of the conflict effect for the mostly no conflict items. |
| mc_c_nmst | A vector containing the parameters for an ex-gaussian distribution, c(n, mu, sigma, tau), where n is the number of trials. |
| mc_nc_nmst | A vector containing the parameters for an ex-gaussian distribution, c(n, mu, sigma, tau), where n is the number of trials. |
| mnc_c_nmst | A vector containing the parameters for an ex-gaussian distribution, c(n, mu, sigma, tau), where n is the number of trials. |
| mnc_nc_nmst | A vector containing the parameters for an ex-gaussian distribution, c(n, mu, sigma, tau), where n is the number of trials. |
| num_sims | A number, simulations to run |
| alpha | A number, alpha criterion |
Value
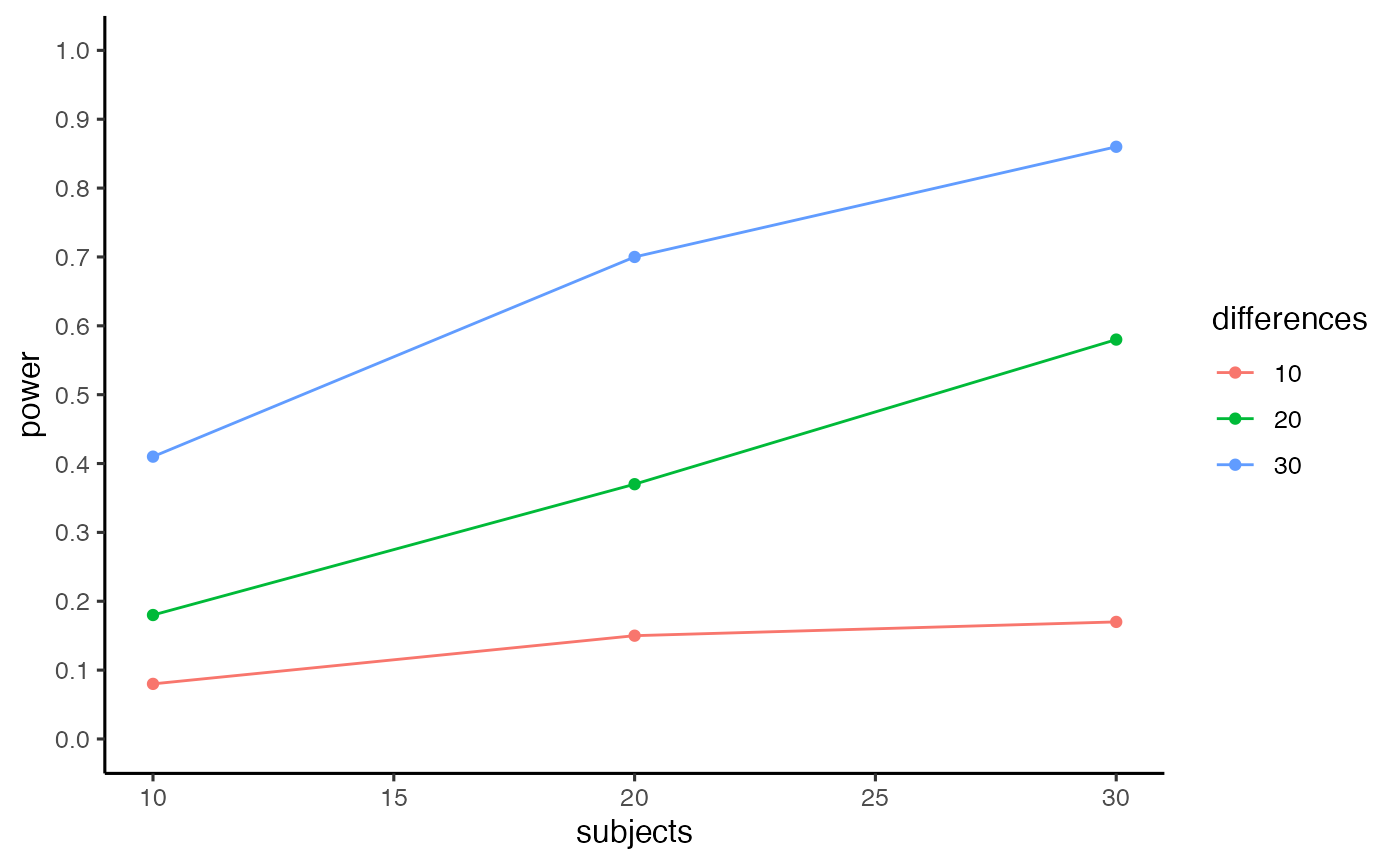
A list, $power_table contains a table with power estimates as a function of number of subjects and mean differences, $power_curve contains a graph (using ggplot2) showing power as a function of subjects and mean differences
Details
This function is an extension to pc_power_fast, that allows multiple estimates of power for a vector specifying numbers of subjects and mean differences.
This function uses monte-carlo simulation to determine statistical power associated for detecting a conflict effect, and includes paramaters for number of subjects in the experiment, number of trials in each condition (conflict vs. no-conflict), and paramaters (mu,sigma,tau) for each reaction time distribution.
For every simulated experiment, a one sample t-test (two-tailed) is computed, and the p-value is saved. Power is the proportion of simulated experiments that return p-values less than the defined alpha criterion.
Examples
test <- pc_power_table(subjects = c(10,20,30),
                differences = c(10,20,30),
                base_conflict = 100,
                mc_c_nmst = c(50,705,80.7,157.5),
                mc_nc_nmst = c(50,625,68.6,166.3),
                mnc_c_nmst = c(50,725,80.7,157.5),
                mnc_nc_nmst = c(50,625,68.6,166.3),
                num_sims = 100,
                alpha = .05)
test$power_table
#>   subjects differences power
#> 1       10          10  0.08
#> 2       20          10  0.15
#> 3       30          10  0.17
#> 4       10          20  0.18
#> 5       20          20  0.37
#> 6       30          20  0.58
#> 7       10          30  0.41
#> 8       20          30  0.70
#> 9       30          30  0.86
test$power_curve