Chapter 15 Network Analysis tutorial
Author: Jiaxin Deng
15.1 Brief introduction to network analysis
A network is a set of nodes connected by a set of edges.
Several packages are used in the network analysis, including network, statnet, igraph and qgraph.
qgraph was developed in the context of psychometrics approach by Dr. Sacha Epskamp and colleagues in 2012. For more details, please click this following link for the paper published in Journal of Statistical Softare:
https://www.jstatsoft.org/article/view/v048i04
This package can create graphs to visualize the statistics in different layout modes based on different correlation matrices, such as polychoric correlation, partial correlation.
15.2 Example code
Here is the following steps to conduct a network analysis using qgraph.
Take big5 data as an example. This is a dataset of the Big five personality traits assessed on 500 psychology students.
Firstly, qgraph package should be activated using library()
library(qgraph)And then, data need to be imported in the current R project.
data(big5)To creat the graph is basically to use qgraph(), such as:
qgraph<-qgraph(cor(big5))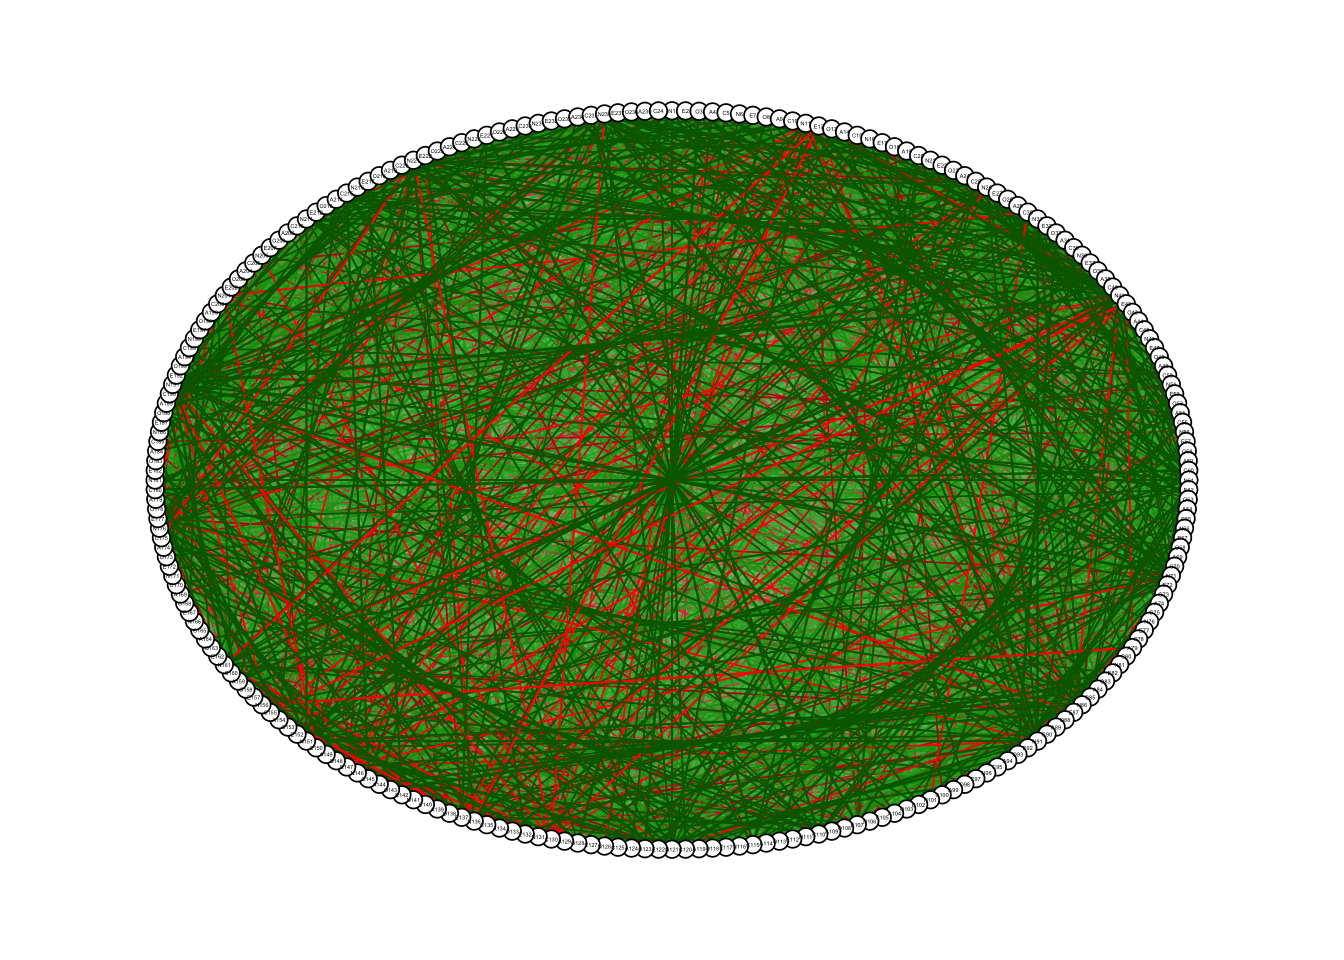
But it should be noted that the input in the qgraph() can be a weight matrix or an edgelist.
Thus, if you want to creat the association network, cor()/cor_auto() can be used to creat the matrix first.
Also, you can use groups to indicate which nodes belong together, such as:
data("big5groups")
qgraph(cor(big5), groups=big5groups)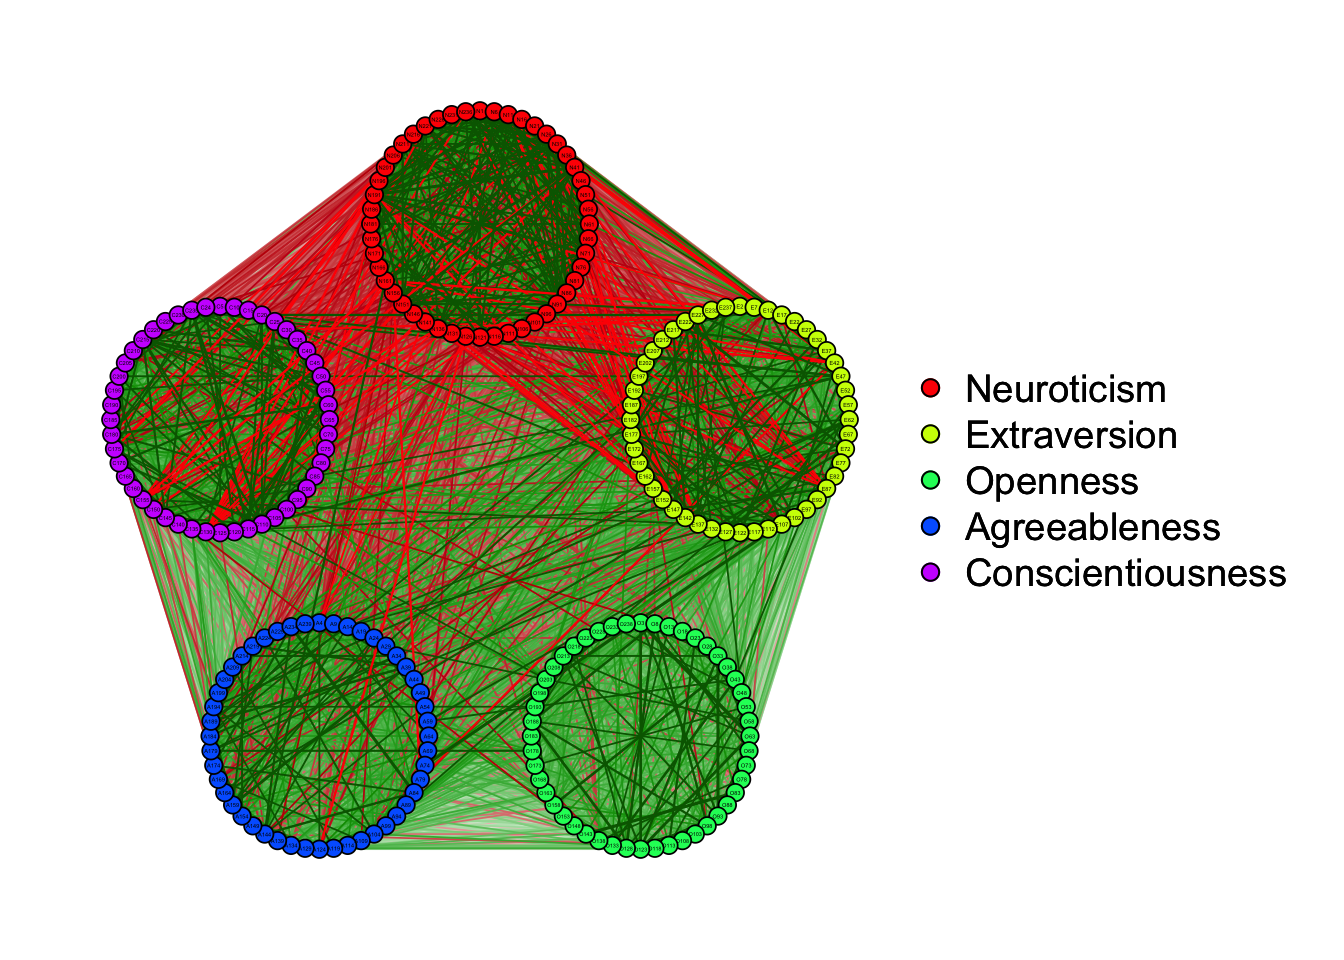
Besides, you can use some additional arguments to customize your representing graph.
you can use layout to change the representation, such as:
qgraph(cor(big5), groups=big5groups,layout= "spring")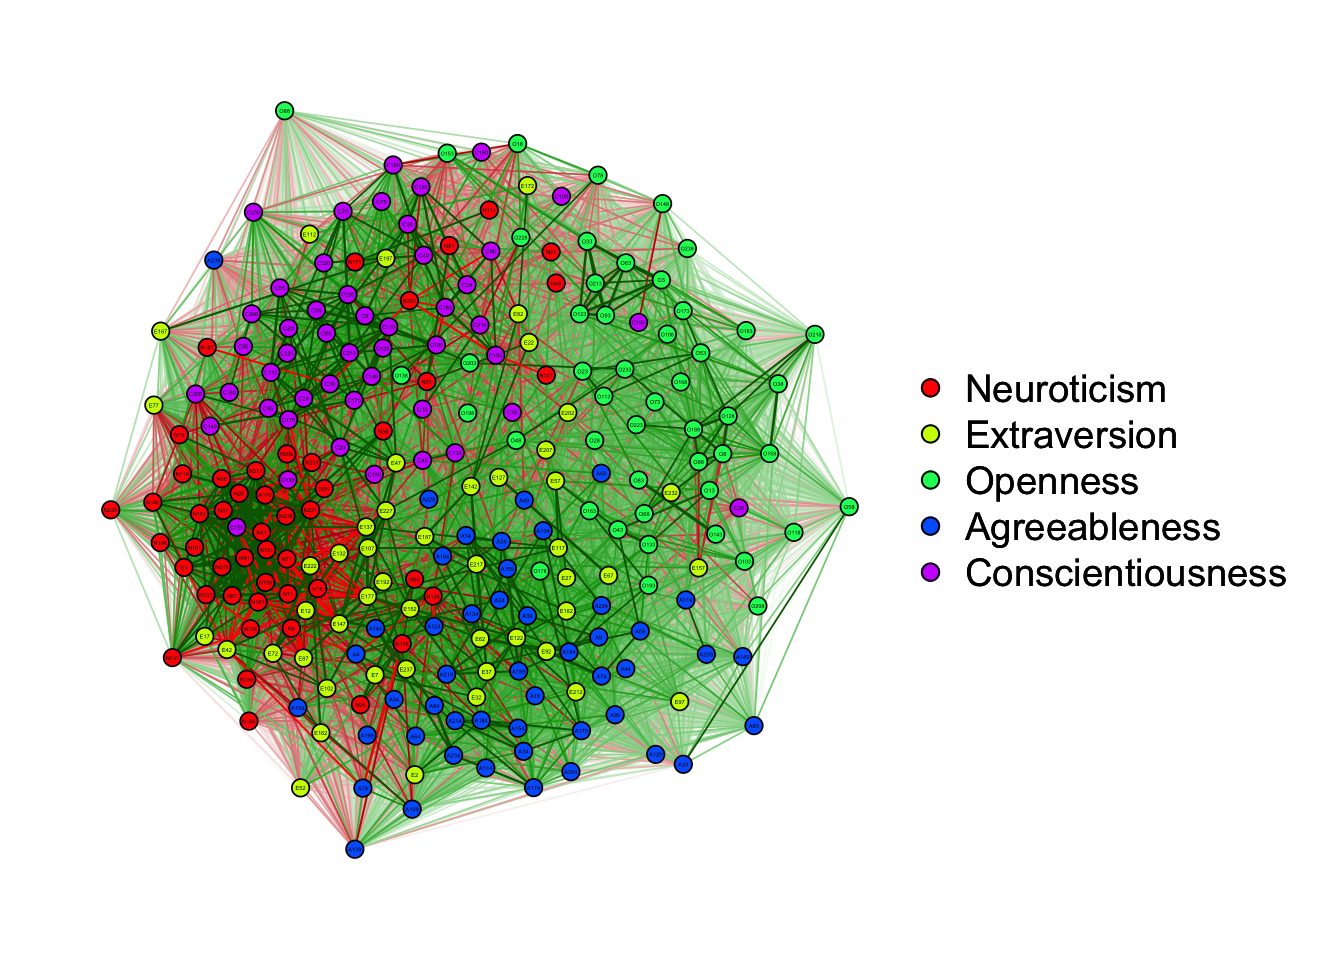
qgraph(cor(big5), groups=big5groups,layout= "circle")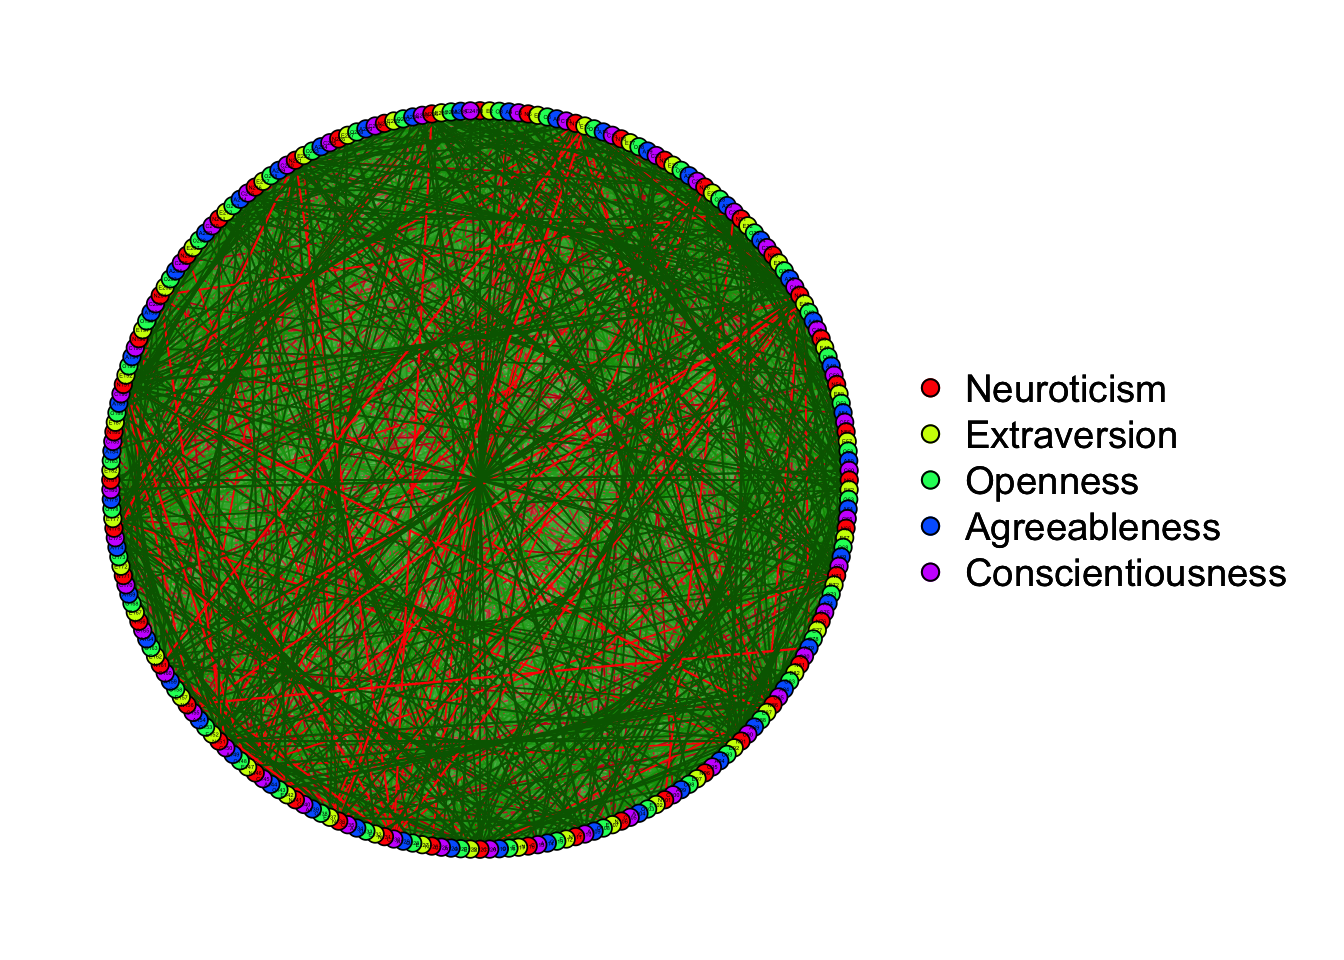
15.3 Including Plots
You can also embed plots, for example:
Note that the echo = FALSE parameter was added to the code chunk to prevent printing of the R code that generated the plot.