Lab2
Lab2.Rmd- (3 points) The following code roughly reproduces figure 5.5 from the textbook [@abdiExperimentalDesignAnalysis2009]. Modify the ggplot code so that the graph looks as close as possible to the figure from textbook:
- change the x-axis title
- change the y-axis title
- make the x-axis and y axis ticks the same
- include different symbols to differentiate the lines
library(tibble)
slamecka_design <- tibble(number_of_learning_trials = rep(c(2,4,8), each=6),
                          number_of_IL = rep(rep(c(2,4,8), 2), 3),
                          subjects = 1:18,
                          recall = c(35,21,6,
                                   39,31,8,
                                   40,34,18,
                                   52,42,26,
                                   61,58,46,
                                   73,66,52
                                   )
                          )

slamecka_design$number_of_learning_trials <- as.factor(slamecka_design$number_of_learning_trials)

library(ggplot2)
ggplot(slamecka_design,aes(x=number_of_IL,
                           group = number_of_learning_trials,
                           shape = number_of_learning_trials,
                           y=recall))+
  geom_line(stat = "summary", fun = "mean")+
  geom_point(stat = "summary", fun = "mean")+
  theme_classic()+
  xlab("Number of interpolated lists")+
  ylab("Number of words correct")+
  scale_y_continuous(breaks=c(20,40,60,80), limits=c(0,80))+
  scale_x_continuous(breaks=c(2,4,8), limits = c(1,12))+
  theme(legend.position = "none")+
  annotate("text", x = 10, y = 50, label = "8 learning trials")+
  annotate("text", x = 10, y = 22, label = "4 learning trials")+
  annotate("text", x = 10, y = 8, label = "2 learning trials")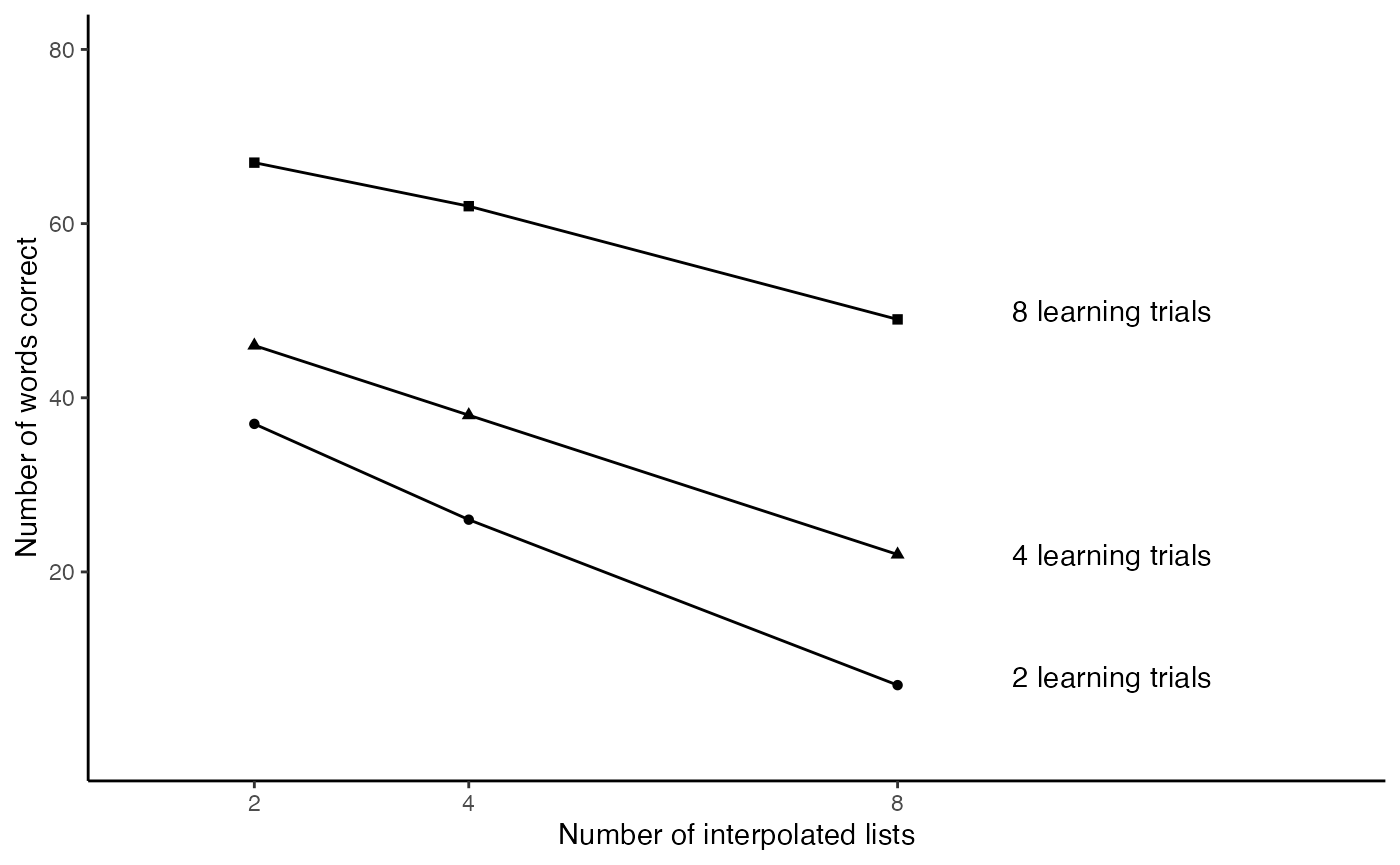
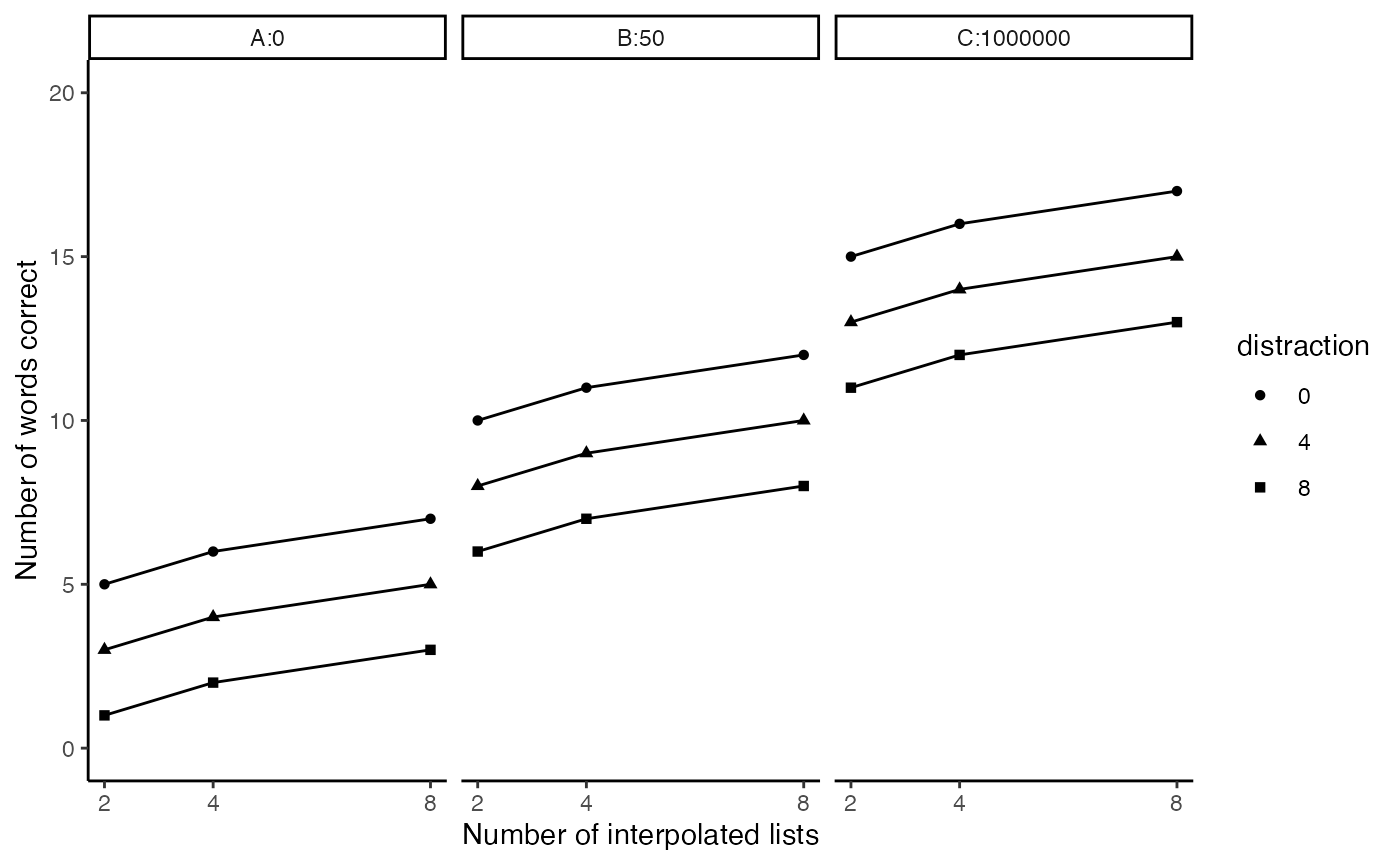
- (3 points) The Slamecka design was a 3x3 design. The practice variable had three levels (2, 4, and 8), and was assumed to increase memory recall with increasing amount of practice. The interpolated learning (IL or distraction) variable had three levels (0, 4, and 8), and was assumed to decrease memory recall with increasing amounts of distraction.
Imagine Slamecka had included a third independent variable that also had three levels. This new IV is expected to increase memory recall. For example, maybe the third IV is amount of reward given to subjects (0, 50 dollars, 1 million dollars) for completing the study. As the amount of expected reward is increased, subjects are more motivated so they remember more words.
Use R to create a dataframe to represent predictions for this new 3x3x3 design. Then use ggplot and facet wrapping to show predicted means for each condition. As a hint, I have provided a drawing and I expect your ggplot graph will look something like this drawing.
new_data <- tibble(reward = rep(c("A:0","B:50","C:1000000"), each = 9),
                   practice = rep(rep(c(2,4,8), each = 3),3),
                   distraction = as.factor(rep(c(0,4,8),9)),
                   recall = c(5,3,1,
                              6,4,2,
                              7,5,3,
                              10,8,6,
                              11,9,7,
                              12,10,8,
                              15,13,11,
                              16,14,12,
                              17,15,13
                              )
                   )
ggplot(new_data,aes(x=practice,
                    group = distraction,
                    y=recall,
                    shape=distraction))+
  geom_line()+
  geom_point()+
  theme_classic()+
  xlab("Number of interpolated lists")+
  ylab("Number of words correct")+
  scale_y_continuous(breaks=c(0,5,10,15,20), limits=c(0,20))+
  scale_x_continuous(breaks=c(2,4,8))+
  facet_wrap(~reward)